
Analysts use a variety of tools when working with Google Analytics and Google Tag Manager. In this article, I would like to pay attention to those main extensions and applications that I use most often and greatly simplify the detection and correction of errors that occur. Each of the tools is free, so feel free to use them too.
An extension for Google Chrome that shows installation errors and warnings for Google Analytics Tracking Codes (Google Analytics Tracking Code), Google Tag Manager and Adwords Conversion Tracking.
In addition, the tool allows you to record tags during the transition through the pages of the site. As a result, you can get detailed information about which tags were launched, whether errors occurred, which pages were viewed. The Tag Assistant also gives you the option to get a Google Analytics report that includes information about the data sent to the analytics, such as audience, behavior, events, and conversions.
Another useful extension for Google Chrome, which displays basic statistics from the corresponding Google Analytics account directly on the loaded page of the site, provides the ability to compare data for certain periods and segment them.
The extension allows you to display in the developer console in Google Chrome errors and warnings for the implementation of the tracking code, and the data sent to the analytics.
An essential tool for professionals who want to monitor and debug the data sent from the site using tags.
WASP.inspector adds a new tab to Chrome developer tools:
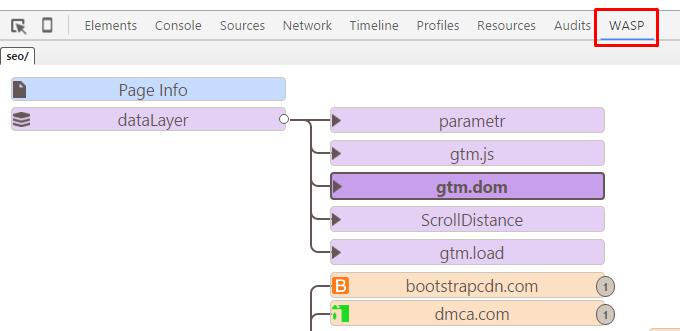
The main functions of WASP are:
- Definition of tags of any type
- Eye-catching visualization that allows you to see the relationships between tags
- Clear names that allow you to clearly understand what data is sent to analytics
- SEO information about the page from which the data is sent
- Representation of the information contained in the dataLayer
- Ability to block tags for debugging
Regular expressions are used in various programming languages to search for certain patterns in text. Google Analytics also uses regular expressions. They provide some flexibility when working with data filters.
This simple application for Google Chrome allows you to quickly create and test the functionality of a regular expression.
To practice regular expressions, you can also use the resource https://regex101.com/.
If you use Google Tag Manager in your work, then this tool can help you debug tags. You create all the necessary tags, triggers, and variables in GTM, and then use the Tag Manager Injector to add the GTM container ID through the browser without directly injecting it through the site's source code.
The tool allows you to get the javascript code of text elements on the page. To do this, select any text area and click on the extension icon. Go to the Console tab in Chrome developer tools. There you will see the code that can be used to create a JavaScript variable in GTM.
More extensions and tools can be found in the Google Chrome store, application galleries, which extend the functionality of Google Analytics, as well as in the list of Mozilla Firefox add-ons.
If you can suggest additional good tools that you should keep in your piggy bank, write in the comments 🙂
Author: web-programmer of the StarMarketing agency of strategic Internet marketing Ekaterina Demyanchuk